
goal readiness radar
Can your lab get there from here?
Pick your goals, score how your lab runs quality today, and see whether your current setup can carry you there. The shape shows where compliance holds up and where it strains.
Your results update as you go
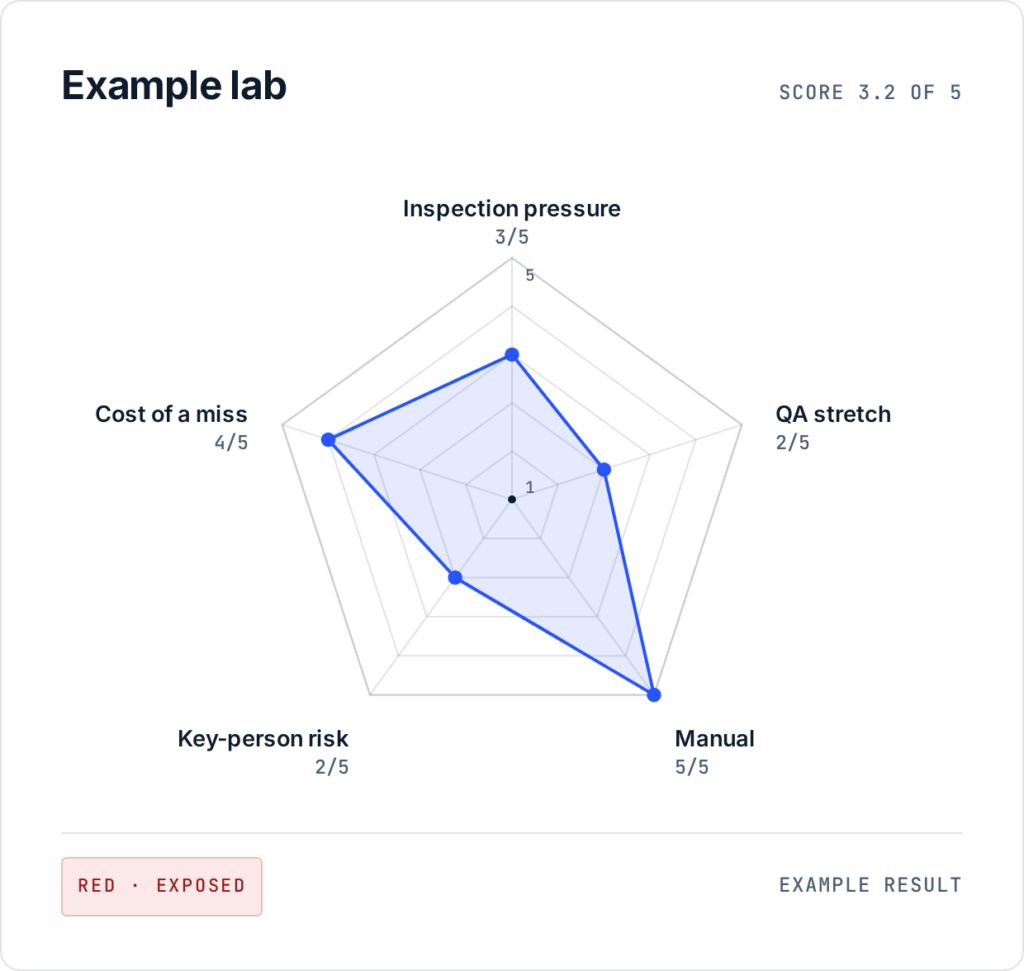
An objective look at your lab
The radar maps how your lab works today: the inspection load you carry, how thin quality is spread, and how much depends on spreadsheets and memory. Score what's true now, not what you'd like to be true.
The result stands on its own. If your setup can carry your goals, the radar will say so, and a new system won't change much. If it shows strain, you'll see exactly where, and which goals it touches.
Lab size isn't the deciding factor. A seven-person lab with one stretched QA manager and four inspections a year can carry more risk than a fifty-person lab with a system everyone uses. The pattern matters more than the total.
What is the lab working towards?
Score your lab
Inspection window
Your lab
How to score each axis
Score 1 for the low description, 3 for medium, 5 for high. Use 2 and 4 when your lab sits between.
How to read the result
The status works like a lab status: the weakest link decides. One area under heavy pressure is enough to change the colour, whatever the average says. Many inspections alone raise the stakes but aren’t a risk on their own, so inspection pressure by itself stops at Yellow. The inspection window then says when a change makes sense.
If your radar shows strain, start where it’s highest.
LabMODO takes the weight off the people carrying quality. No more chasing sign-offs, rebuilding records before an inspection, or holding your breath when one person is out. That’s the room your lab needs to grow, protect revenue and run leaner.
Labs that stopped running on heroics.
When the auditor asks a question, I know where to look. The stress is gone.
Audit findings related to training, SOP, or calibration tracking across client labs since rollout.
Analyst adoption within 30 days of rollout — the number that matters most for a tool that has to get used.